Martes, Pebrero 2, 2016

PCOMP worst case scenario: Head & Shoulders

PSEi 6,642.45
-0.88% -58.91


Fig 1. Worst case scenario for PSEi


Fig 2. H&S pattern (from investopedia.com) 

Hope this doesnt happen.


Biyernes, Enero 29, 2016

FLI

FLI is trying to break its 1.5-1.51 resistance
if it does, I expect it to consolidate around 1.65-1.85
and if things go right it will probably go 2 and above.
Of course if it fails to break 1.5-1.51 resistance I expect this to go below 1.3

Biyernes, Enero 22, 2016

Did they bounce?

Reviewing my last 2 post before this one
s
ALI went as high as 29 then closed at 28.6, a 5.15% increase

FPH closed 3.05% higher than yesterday

AGI also increased by almost 4%

Well it seems everyone bounced as predicted, almost...

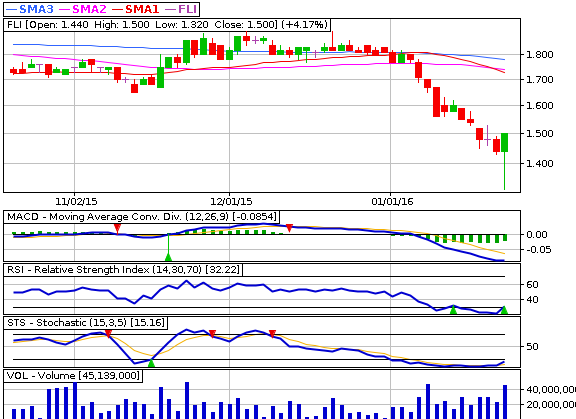
FLI with bullish hammer was sort of a failure, but I'll wait for price action next week before we say its a false bullish hammer.

Huwebes, Enero 21, 2016

FLI: BREAKING DOWN 'Hammer'

BREAKING DOWN 'Hammer'


A hammer occurs after a security has been declining, possibly suggesting the market is attempting to determine a bottom. The signal does not mean bullish investors have taken full control of a security, it simply indicates that the bulls are strengthening.

Source: investopedia

Will they bounce tomorrow?

I have written FIBOs/GAPs of ALI, FPH and AGI in my previous posts. Incidentally today, they closed within those figures.

ALI's
  • Day Range 27.20 - 28.65 
  • Gap closed (see previous post )

FPH
  • closes at 50.8 within Fibo (61.8%): 49-51
  • RSI 14!

AGI
  • closes at 12.7 (Fibo 61.8%)
  • RSI 19

Martes, Enero 19, 2016